Device Refresh Planning
The Device Refresh Planning report shows where each device sits in its useful life, so you can plan and budget replacements before hardware ages out. It combines each device's purchase date with a useful-life policy to work out when the device is due to be replaced, groups the fleet by refresh status, and forecasts how many devices come due each year.
Turning on Lifecycle Tracking
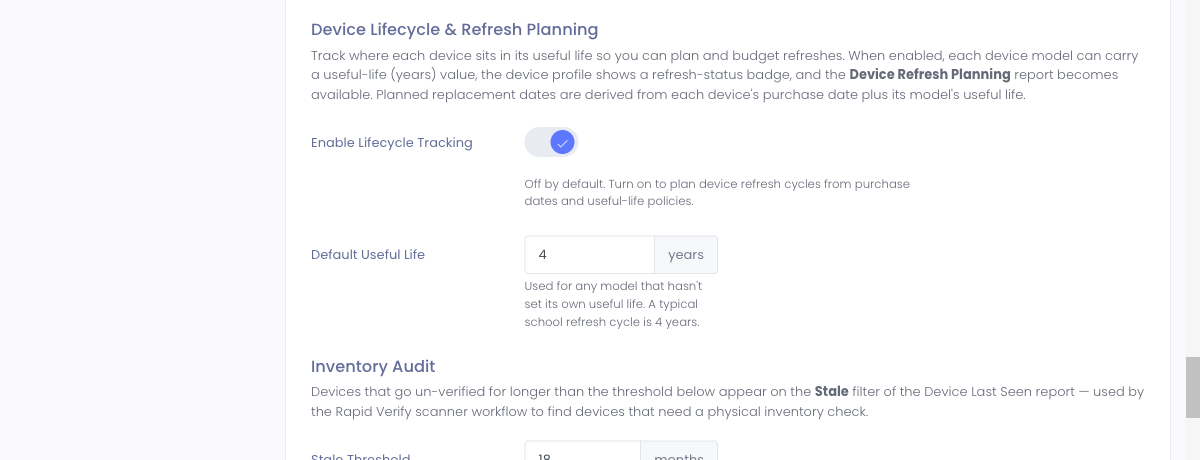
Lifecycle tracking is off until you enable it.
- Go to Settings → Inventory Settings.
- Under Device Lifecycle & Refresh Planning, turn on Enable Lifecycle Tracking.
- Set a Default Useful Life in years. This is used for any device model that doesn't have its own value. A typical school refresh cycle is four years.
- Save.
Once enabled, the report appears under Reports → Devices, a refresh-status badge shows on each device's profile, and both device categories and device models gain useful-life and replacement-cost fields.
Setting Useful Life and Replacement Cost
Different device types last different amounts of time and cost different amounts to replace. You can set a useful life and a replacement cost at two levels, and each device uses the most specific value available:
Per category (set once for a whole group of models):
- Go to Settings → Inventory Settings → Categories and edit a category.
- Enter its Useful Life (years) and Replacement Cost. Every model in that category uses these values unless the model sets its own.
Categories can be nested, and a subcategory that leaves a value blank inherits it from its parent category (and on up the tree). So you can set a useful life and replacement cost once on a top-level category like Computers, and every subcategory beneath it uses those values until you give a subcategory its own. A subcategory's own value always overrides what it would otherwise inherit.
Per model (override the category for one specific model):
- Go to Settings → Device Models and edit a model.
- Enter the Useful Life (years) and Replacement Cost for that model.
- Leave either blank to fall through to the model's category, then to the district default (for cost, blank at both levels simply leaves the model uncosted).
So each device resolves its useful life and replacement cost as: the model's own value, then its category's value (inherited up the category tree), then the district default. The planned replacement date is the device's purchase date plus its resolved useful life, and its resolved replacement cost feeds the dollar forecast below.
Reading the Report
Open Reports → Devices → Device Refresh Planning.
Refresh Forecast by Year
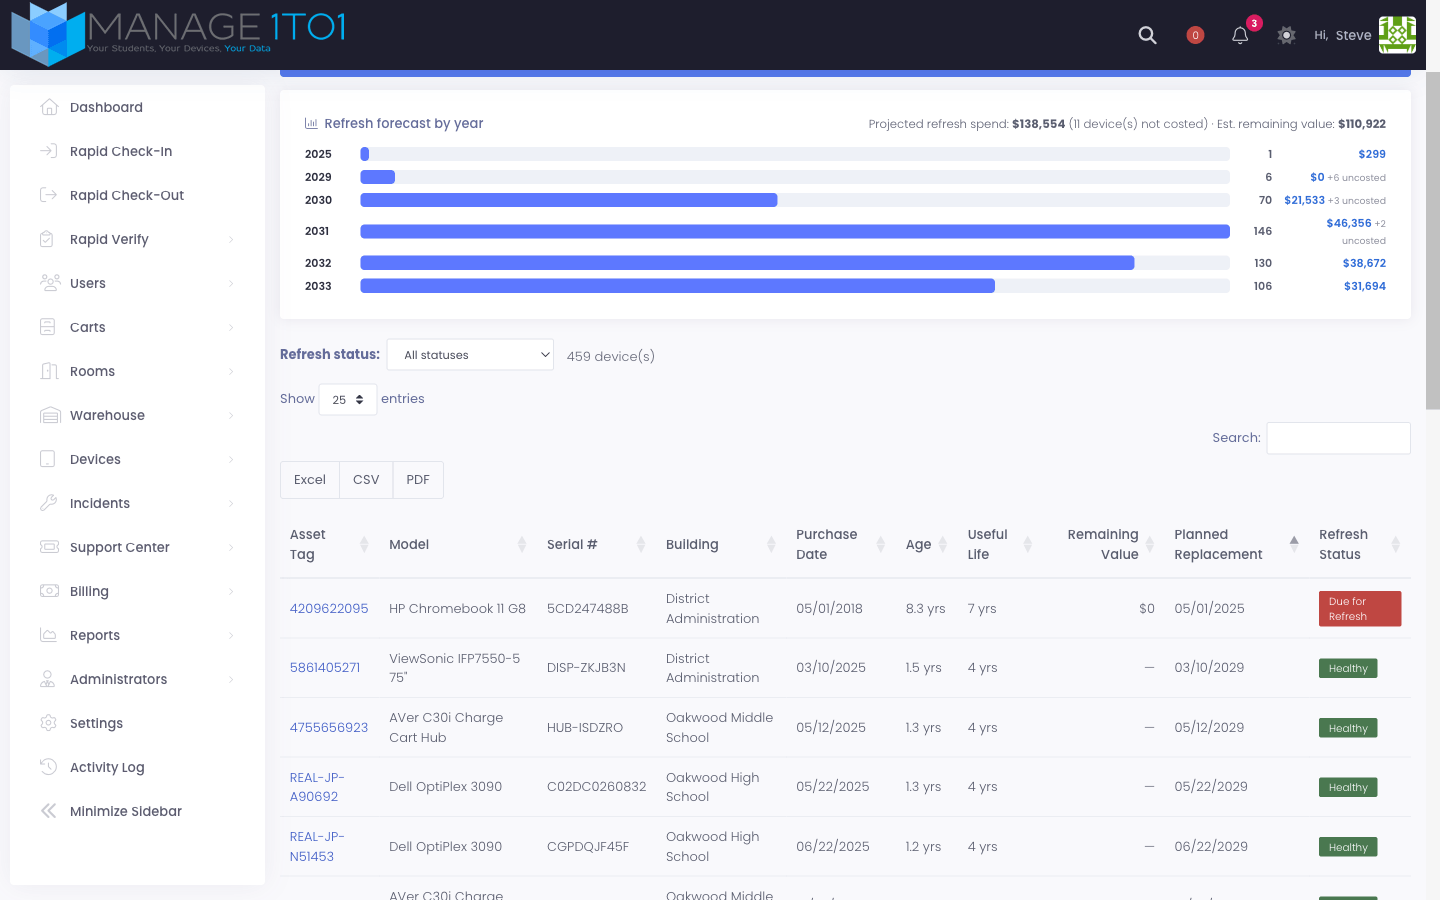
At the top, a Refresh forecast by year chart shows, for each upcoming year, both how many devices are due for replacement and their total replacement cost. This is your budgeting view: it tells you, at a glance, how big each year's replacement wave will be and roughly what it will cost. A Projected refresh spend total for the whole fleet appears in the chart header, and the forecast updates to match whatever filter you have applied to the table below.
Devices whose model has no replacement cost set are still counted, but they contribute nothing to the dollar total and are flagged as not costed, so you always know when a year's dollar figure is incomplete. Set a replacement cost on those models (see above) to fold them into the forecast.
Alongside the projected spend, the header also shows an Estimated remaining value for the fleet. This is an estimate of how much service life is left in the devices you can still use, expressed in dollars: a device's replacement cost scaled down as it ages, so a brand-new device is worth close to its full replacement cost, a device halfway through its useful life is worth about half, and a device at or past its useful life is worth nothing. It gives you a rough sense of the value still sitting in the fleet, and it updates with the table filter just like the projected spend does. It is a planning estimate based on age and replacement cost, not an accounting or book value.
If your district carries a residual value on devices, you can set a Salvage Value Floor under Settings → Inventory Settings → Device Lifecycle & Refresh Planning. It's a percentage, and a device's estimated remaining value never drops below that share of its replacement cost, even once it's past its useful life. Leave it at 0 (the default) to depreciate straight-line all the way to $0.
The Device Table
Each row shows one device with:
- Asset Tag — click it to open the device.
- Model, Serial #, and Building.
- Purchase Date — the date the device was acquired.
- Age — how long the device has been in service.
- Useful Life — the expected service life in years (the model's value, or the district default).
- Remaining Value — an estimate of the device's remaining worth: its replacement cost scaled down by how far it is through its useful life. A device at or past its useful life shows $0, and a device with no replacement cost shows a dash.
- Planned Replacement — the date the device is expected to be replaced.
- Refresh Status — where the device is in its life (see below).
The table sorts by planned replacement date, soonest first, so the devices you need to budget for next rise to the top. Use the search box, the column tools, and the export buttons (Excel, CSV, PDF) to build and share a replacement worklist.
Refresh Status
Each device carries one of four statuses:
- Healthy — comfortably within its useful life.
- Approaching Refresh — nearing its planned replacement date, so it's time to start planning.
- Due for Refresh — at or past its planned replacement date.
- Unknown — the device has no purchase date on file, so a planned date can't be calculated. Add a purchase date to bring it into the plan.
Use the Refresh status filter to focus on a single group. For example, filter to Due for Refresh to get the list of devices to replace right now, then export it.
Filtering by Building
Next to the status filter, a Building filter narrows the whole report to a single campus. When you pick a building, the table, the yearly forecast, the Projected refresh spend, and the Estimated remaining value all recalculate for just that building, so a multi-campus district can budget one school at a time. The two filters work together, so you can, for example, see everything Due for Refresh at a single building. Leave it on All buildings for the district-wide view.
Planned replacement dates are only as good as the purchase dates behind them. Devices missing a purchase date show as Unknown and won't appear in the yearly forecast, so filling in purchase dates during intake keeps your refresh plan complete.
On the Dashboard
For an at-a-glance early warning without opening the report, add the Device Refresh widget to a dashboard. It shows how many devices are Due for Refresh and Approaching Refresh across the fleet, with a button straight to this report. The widget is available once lifecycle tracking is on.
On the Device Profile
When lifecycle tracking is on, each device's profile shows a Refresh Status badge next to its purchase date, color-coded to match the report. Hover the badge to see the planned replacement date. Just below it, an Est. Remaining Value line shows that single device's estimated remaining worth, the same figure the report's Remaining Value column shows. It appears only when the device has a replacement cost and a purchase date to estimate from. Together these give technicians the refresh picture for a single device without opening the report.