Building Groups
Building Groups let you roll your buildings up more than one way at once. Create a grouping such as School Level or Region, add groups to it (Elementary, Middle, High), and choose which buildings belong to each. Your dashboard charts can then total devices, incidents, users, carts, and rooms by any grouping you define, instead of one building at a time.
A building can belong to groups in several groupings at the same time. The same school can sit in Elementary under your School Level grouping and in South under your Region grouping, so you can slice the same fleet by level one moment and by region the next.
You manage building groups under Settings → Building Groups.
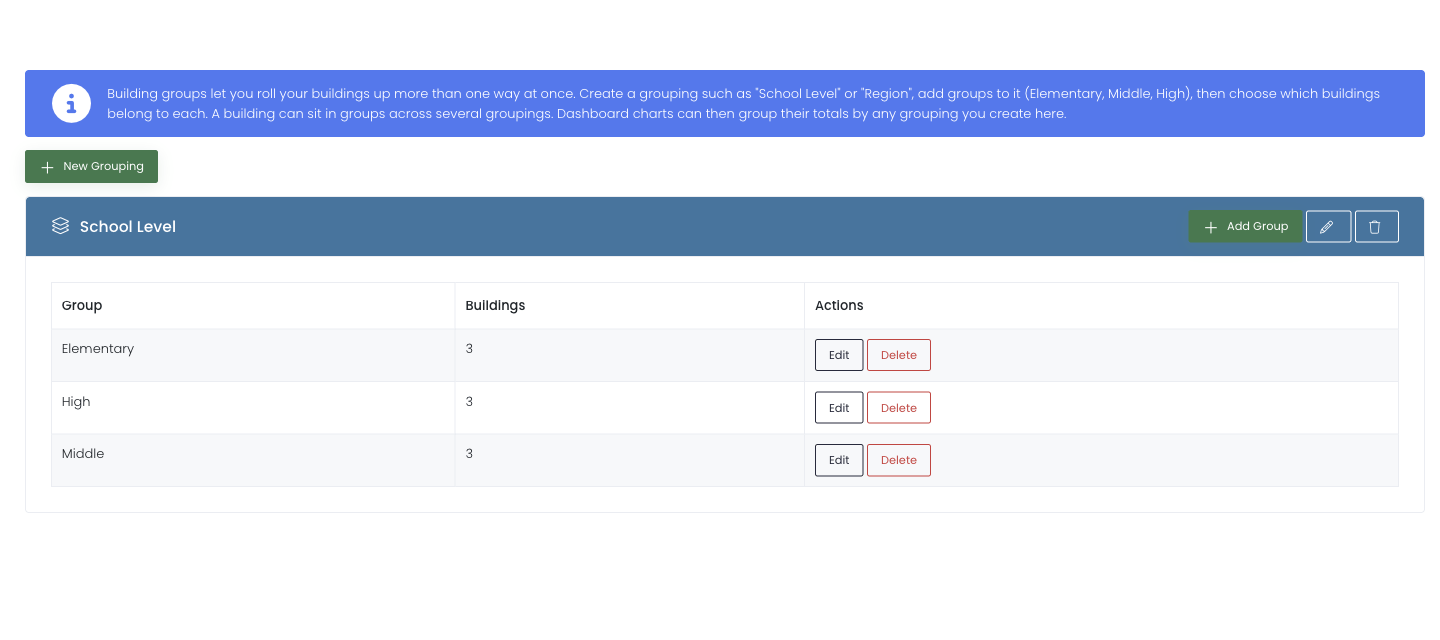
How groupings and groups fit together
- A grouping is a way of dividing up your district, such as School Level or Region. It is the question you want a chart to answer ("how do our devices split by level?").
- A group is one bucket inside a grouping, such as Elementary or South District. Each group holds the buildings that belong to it.
- A building can be placed in groups across as many groupings as you like.
Think top-down. First create the grouping that names the dimension (School Level), then add the groups that live inside it (Elementary, Middle, High), and finally choose the buildings for each group.
Create a grouping
- Go to Settings → Building Groups.
- Select New Grouping.
- Enter a name that describes the dimension, such as School Level or Region, and select Create.
The new grouping appears as its own panel, ready for you to add groups.
Add a group and choose its buildings
- On the grouping's panel, select Add Group.
- Enter a name for the group, such as Elementary.
- In Buildings in this group, search for and select every building that belongs to the group. You can add as many as you like, and a building can already belong to groups in other groupings.
- Select Add Group to save.
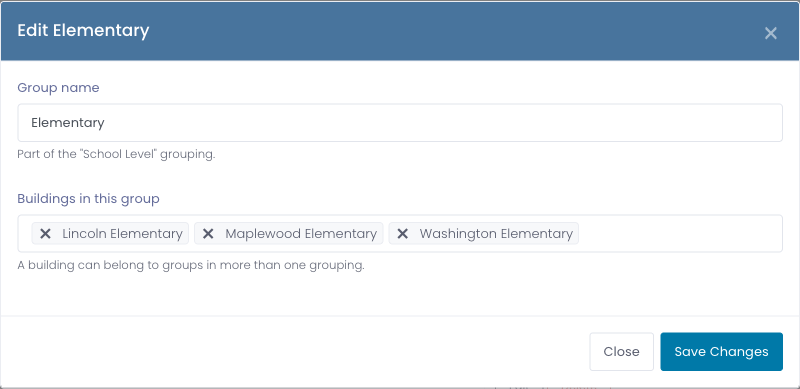
The group now lists how many buildings it contains. Select Edit on any group to rename it or change which buildings belong to it, or Delete to remove the group. Deleting a group or a grouping never deletes the buildings themselves.
Use groupings on your dashboard
Once a grouping exists, it becomes a Group by option on your dashboard charts. When you add or edit a Pie Chart, Bar Chart, or Top-N Table for Devices, Incidents, Users, Carts, or Rooms, your groupings appear in the Group by list alongside the built-in axes. Pick one to see that chart totalled by your groups, for example Devices by School Level or Open Incidents by Region.
A chart grouped by a grouping also shows a (no group) slice for any buildings you have not yet placed in one of that grouping's groups, so nothing is silently left out of the totals. Add those buildings to a group to move them out of that slice.