Metrics Dashboard
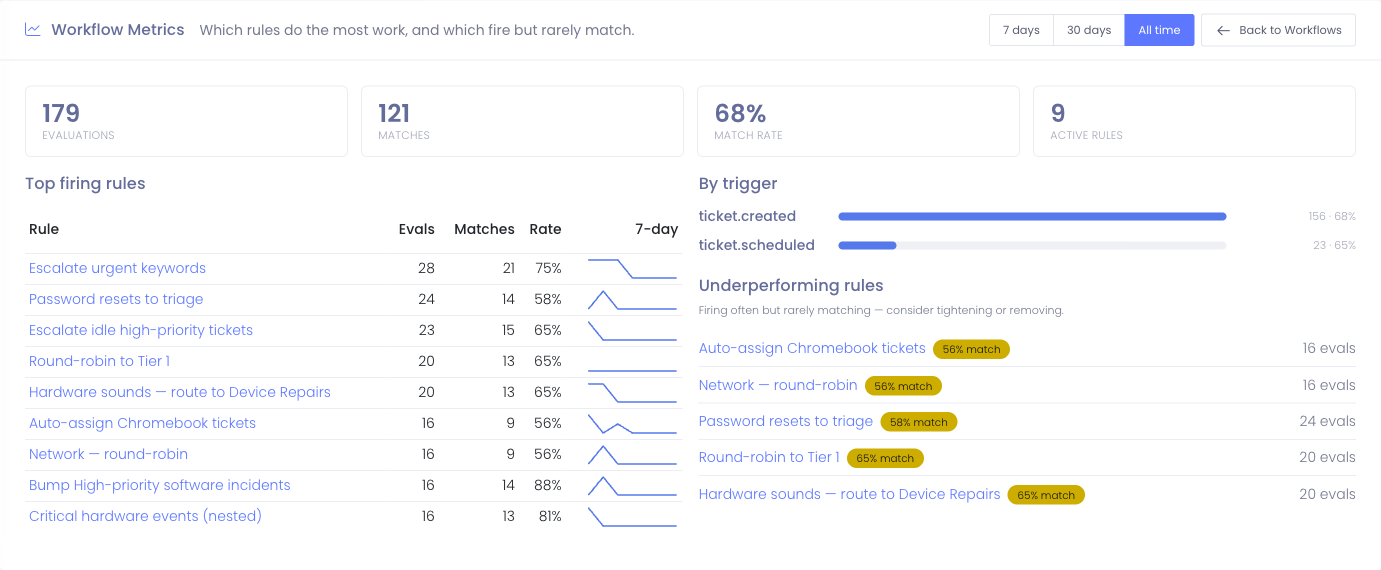
The Metrics dashboard gives you a bird's-eye view of how all your workflows are performing — which ones do the most work, which fire often but rarely match, and how your automation load breaks down by trigger. It's the fastest way to spot rules worth tuning or removing.
Opening the Dashboard
- Go to Help Desk → Ticket Workflows.
- Click Metrics in the top-right corner.
Choosing a Time Window
Use the buttons in the top-right to switch between 7 days, 30 days, and All time. Everything on the page updates to the window you pick.
What You'll See
Totals
Four numbers summarize your automation for the selected window:
- Evaluations — how many times your rules were checked against a ticket
- Matches — how many of those checks met a rule's conditions and ran its actions
- Match rate — matches as a percentage of evaluations
- Active rules — how many rules did any work in this window
Top Firing Rules
The rules doing the most work, most-active first — with their evaluations, matches, match rate, and a small 7-day trend line so you can see whether activity is rising or falling. Click any rule name to open its editor.
By Trigger
How your evaluations break down by what set them off — for example, tickets being created versus scheduled checks — so you can see where your automation load comes from.
Underperforming Rules
Rules that fire often but rarely match. They spend evaluation effort without doing much, so they're good candidates to tighten (so they match more precisely) or remove. Each shows its match rate and how many times it was evaluated.
When There's No Data
If your rules haven't run yet, the dashboard shows a short message. Metrics appear automatically once your workflows start evaluating tickets.