
Quick Stats gives you a quick visual overview of data within your Manage1to1 environment. These graphs and reports are laid out in an easy to understand manner, which is powerful for assisting your colleagues, board of education, and community the amount of work going on within the technology department.
Filtering by Building
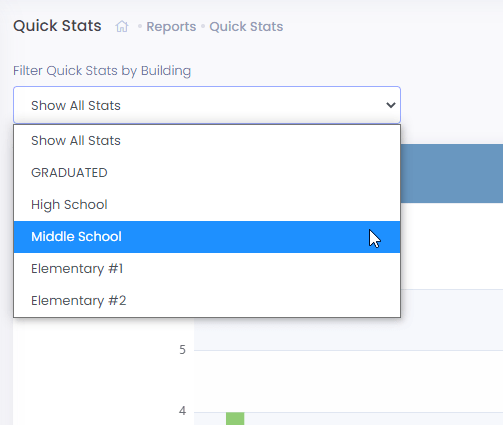
Providing graphs and quick reports on a per-building basis has never been easier. Simply choose your desired building from the dropdown menu and all of the graphs on the page (that pertain to a per-building dataset) will be updated accordingly!
Physical Damage By Month
This graph displays physical damage by each month of the year. Click on the year buttons at the top to toggle on and off.

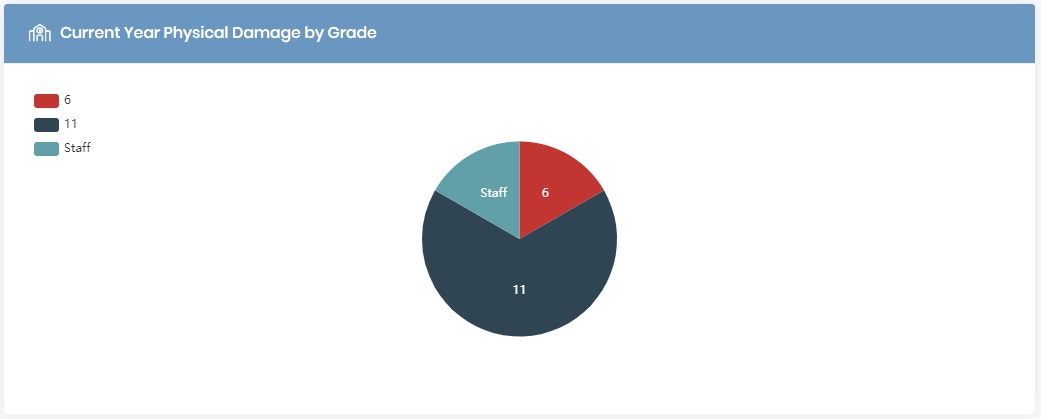
Current Year Physical Damage By Grade
This pie chart displays physical damage by grade level. Click on the grade level buttons at the top left to toggle on and off.
Current Year Physical Damage By Location
This graph displays physical damage whether it occurred on or off school property. Click on the School Property buttons at the top left to toggle on and off.

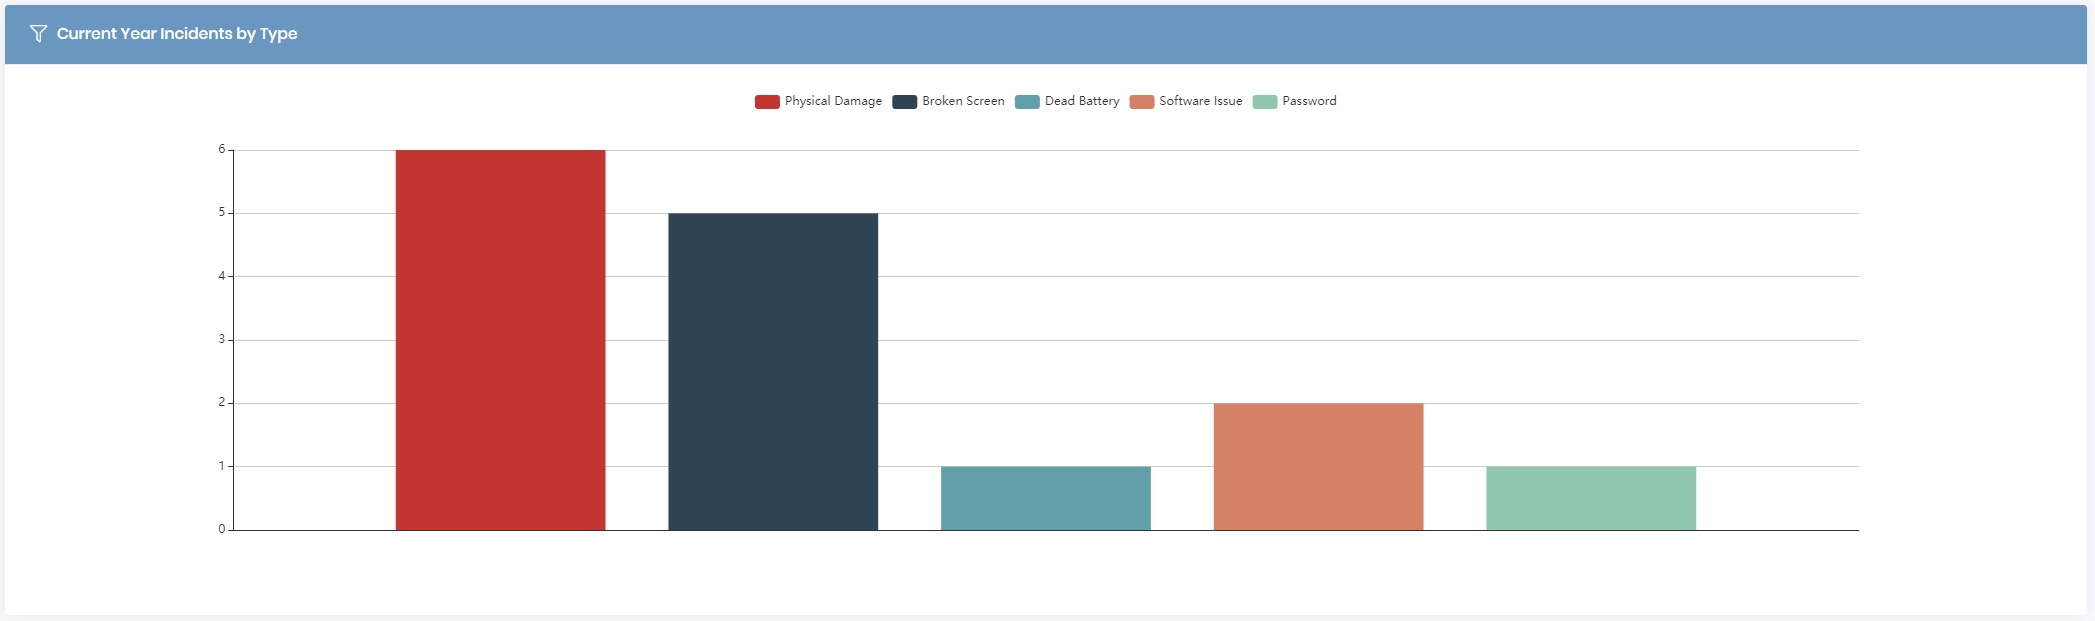
Current Year Incidents By Type
This graph displays physical damage by the type of damage that occurred to a device. Click on the item type buttons at the top to toggle on and off.
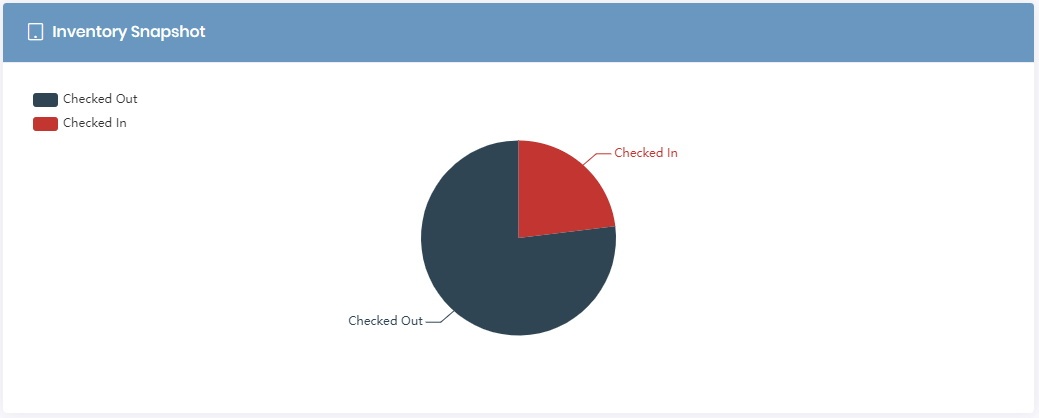
Inventory Snapshot
This graph displays how many devices are checked in versus checked out. Click on the inventory status buttons at the top left to toggle on and off.
Device Checkout By Grade Level
This graph displays how many devices are checked out by grade level. Click on the grade level buttons at the top left to toggle on and off.
